Logging browser script errors with nginx
Posted | Reading time: 6 minutes and 21 seconds.
The more we advance in web technologies, the more we offloaded our workload from the server to the browser. This raises a few new issues, some of which we already had solve once for clients running on workstations - access to the error logs.
When we were running our websites mostly on the server, one of the nice things we had were logs that we could directly access, grep or put in Splunk/ELK/whatever. We gained great insights and visibility of our applications, how stable they were during runtime, and realtime notifications for any errors happening on our application.
When we started moving more in the direction of SPAs (Single Page Applications) we lost this ability, as the errors started to happen more and more in the browser of the user. While you can track those events in Analytics Tools, not always have access to them due to cost reasons, or because we have a project on an on-premise-behind-vpn infrastructure that does not allow to add cloud based tools to their websites.
This little post gives a quick introduction on how to log those browser errors on our servers.
Prerequisites
- Docker
tl;dr
We are going to log unhandled exceptions and console.errors happening in the browser on the server. If you only care for the result, clone my MatthiasKainer/nginx-logging-client-errors repo on github and follow the readme.
The concept
The underlying idea is actually pretty simple. Usually, the html source for web applications are delivered by something that acts as a proxy gateway. This can be either your application (i.e. in java a spring boot application, aspnetcore in .net, express in nodejs…) or a webserver/edge router like nginx or traefik. We want this proxy gateway to expose another endpoint, and then we’ll just log whatever is sent there.

The implementation
We are going to use an nginx, a sophisticated webserver/reverse proxy/load balancer… As we don’t want to get deeply into how to set it up, we will run it in a docker container, and focus on what we need to do to achieve our goal.
Create a new directory and setup the following structure:
.
├── Dockerfile
├── nginx.conf
└── www/
    └── index.html
Let’s configure the nginx first. Open the nginx.conf and fill in the following text:
events {
    worker_connections 8000;
}

http {
    server {
        listen 80;

        root /var/www/public;

        location / {
            include /etc/nginx/mime.types;
            try_files $uri /index.html;
        }
    }
}
This configures the nginx to serve the index.html we have put in the www-root. Let’s create a minimal hello-world so we will be able to see if it works. Open the index.html in the www folder and paste in the following content:
<html>
  <head><title>Hello World</title></head>
  <body>
      <h1>Hello World</h1>
  </body>
</html>
Finally, we set up the docker file. It will allow us to run nginx in an container without being required to install it. Open the Dockerfile and paste the following content:
FROM nginx:alpine

COPY nginx.conf /etc/nginx/nginx.conf
COPY www /var/www/public
There, we are good to go. Open the directory in your terminal, and type the following command:
docker run -p 8080:80 --rm $(docker build -q .)
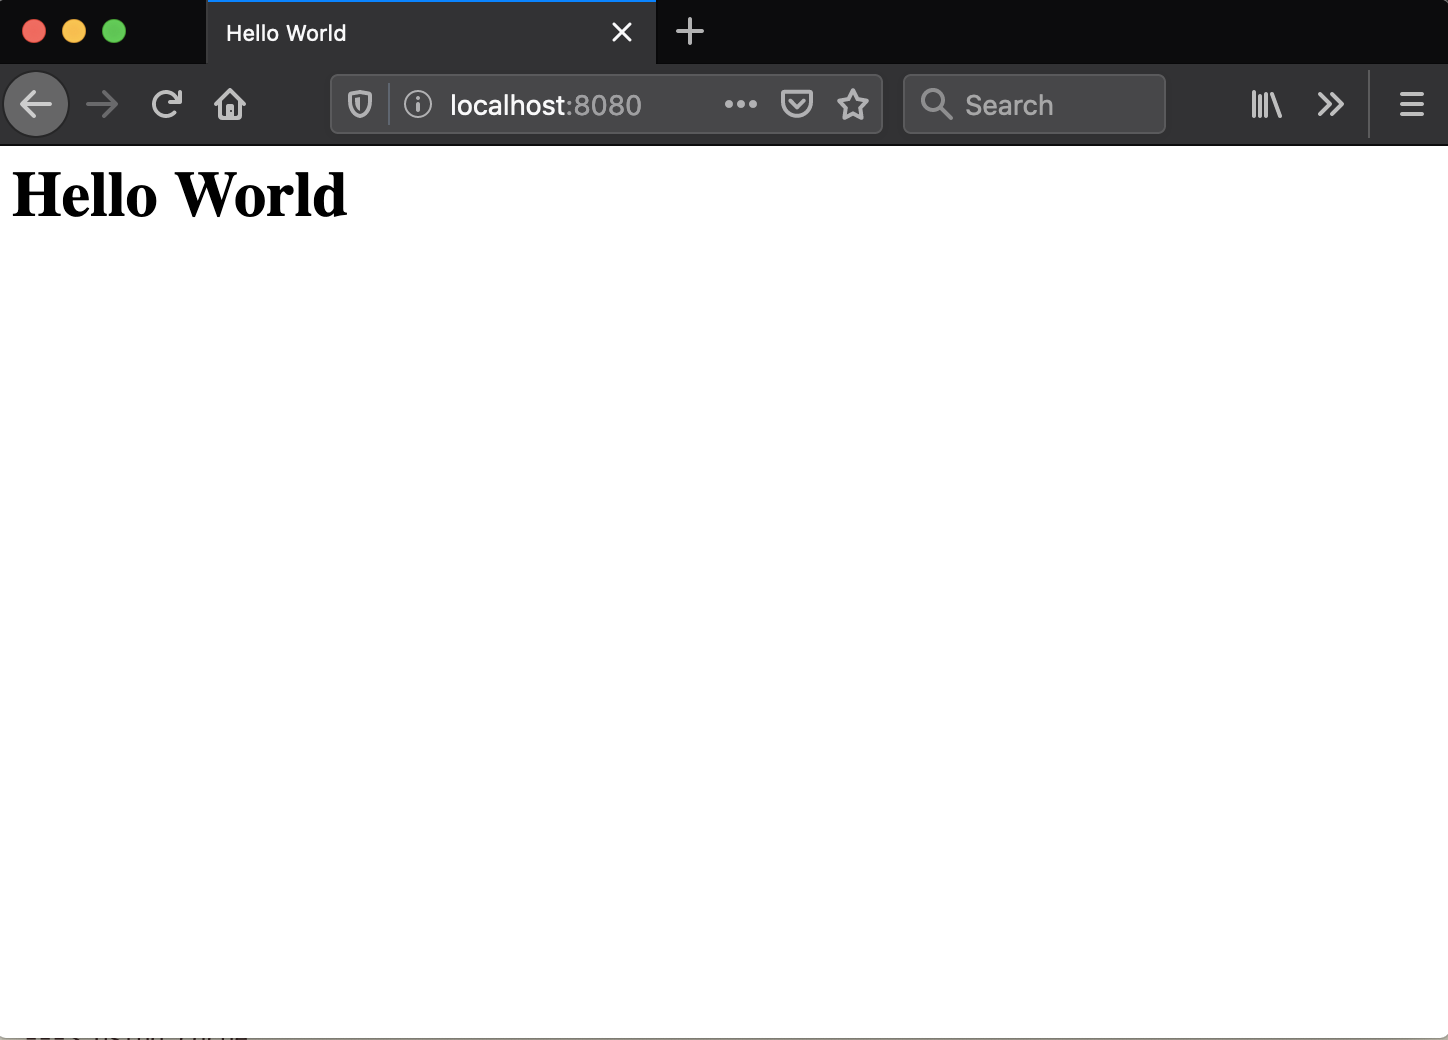
This will start the docker container, and expose it on port 8080. Thus, open a browser and load the page http://localhost:8080. It will display the “hello world” content we added above.

Let’s add something to the page that triggers errors to see the issue I was talking about in detail.
Open the index.html file again, and replace the <body> with the following content:
  <body>
    <h1>Hello World</h1>

    <button id="error">Force an error</button>
    <button id="logger">Log an error</button>
    <script>
      document.getElementById("error").addEventListener("click", () => {
        throw new Error("Very unhandled exception!");
      });
      document.getElementById("logger").addEventListener("click", () => {
        console.error("Logging something terrible bad!", "oh", "dear");
      });
    </script>
  </body>
What this does is adding two buttons, and two events that happen when they are clicked.
- The first one is triggering an unhandled exception.
- The second is logging an error.
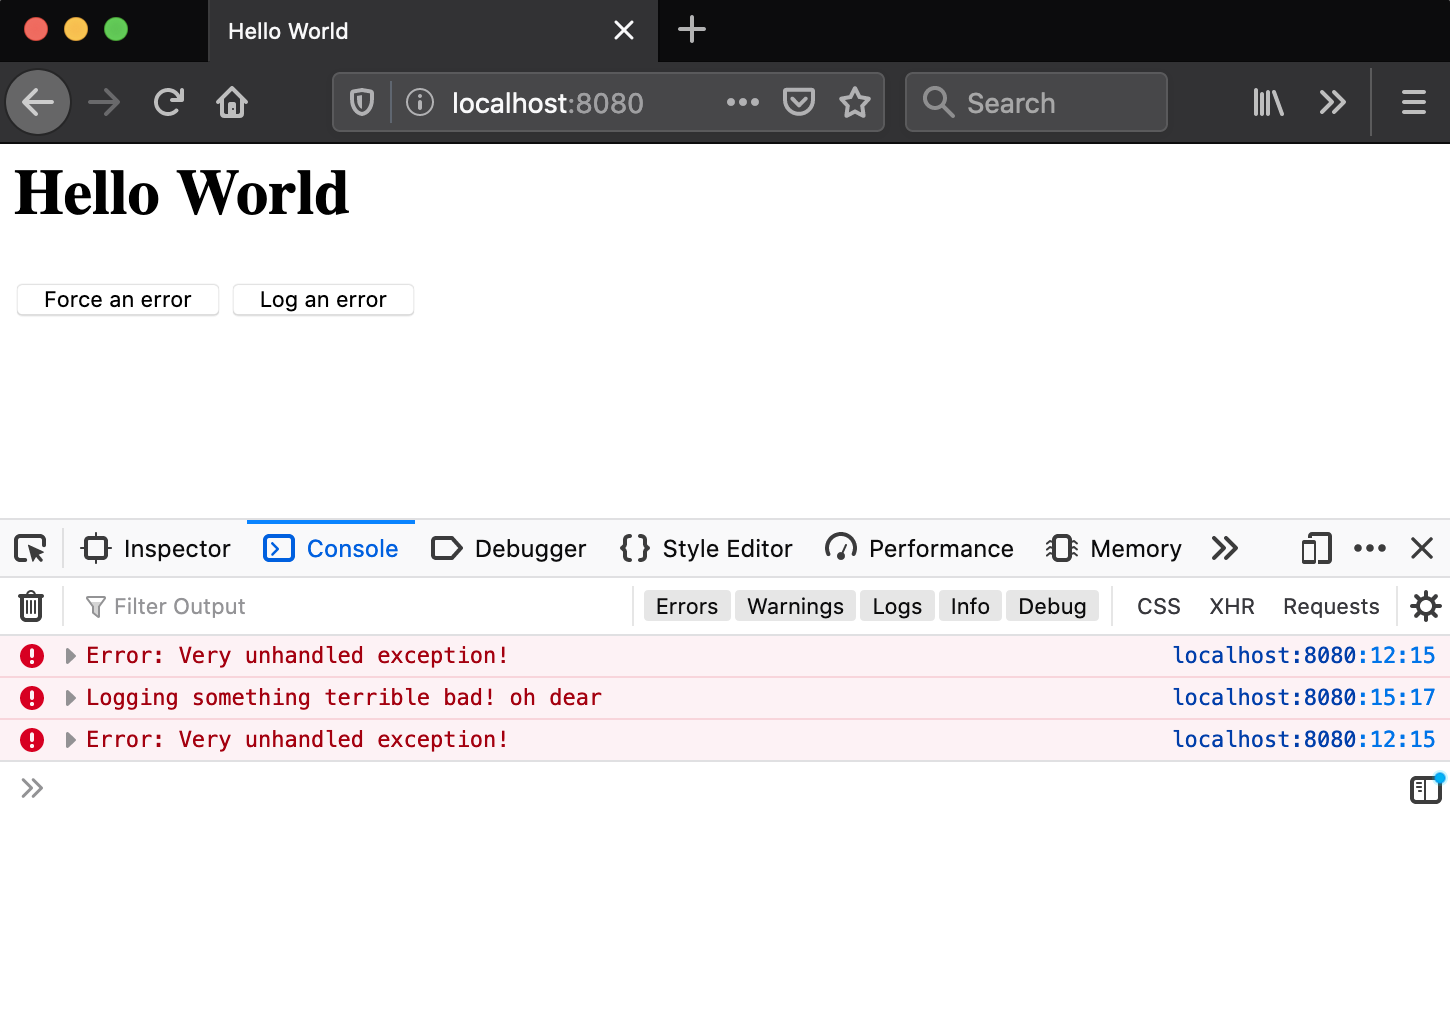
Open the page, and the developer console, and click the buttons to see what happens.

The errors that we trigger are nicely visible in the browser’s developer tool. However, if we look at our server logs, all we can see is
172.17.0.1 - - [29/Feb/2020:12:00:14 +0000] "GET / HTTP/1.1" 200 523 "-" "Mozilla/5.0 (Macintosh; Intel Mac OS X 10.15; rv:73.0) Gecko/20100101 Firefox/73.0"
Why is that an issue? If you run a website, it’s usually not you but your users that have those exceptions. As they will be logged only in the browser, you will never become aware of the fact that something is going wrong unless they call you.
To prevent this, we will send those errors directly to an endpoint in our nginx. The nginx will log it, and we will be able to see that’s happening.
Setting up the nginx
First, let’s take the nginx and create the endpoint. First, we are adding an error_trace format that includes the body of the request. Add the following line to your nginx.conf in your http part
http {
+    log_format error_trace '"Client Error: $request_body"';
    server {
then we have to create two routes for the logging to work, like so:
        location / {
            include /etc/nginx/mime.types;
            try_files $uri /index.html;
        }

+        location = /client_error_trace {
+            access_log /dev/stdout error_trace;
+            proxy_pass http://127.0.0.1/client_error_trace_proxy;
+        }
+        location = /client_error_trace_proxy {
+            access_log off;
+            return 200 'Error logged';
+        }
    }
Why two? Nginx doesn’t parse the client request body unless it really has to, so it usually does not fill the $request_body variable that we wanted to write out in our error_trace.
It makes an exception if it send the request to a proxy, which is what we do - we proxy it to a second route, where we don’t log (to avoid double logs), and return the status 200 indicating all is good.
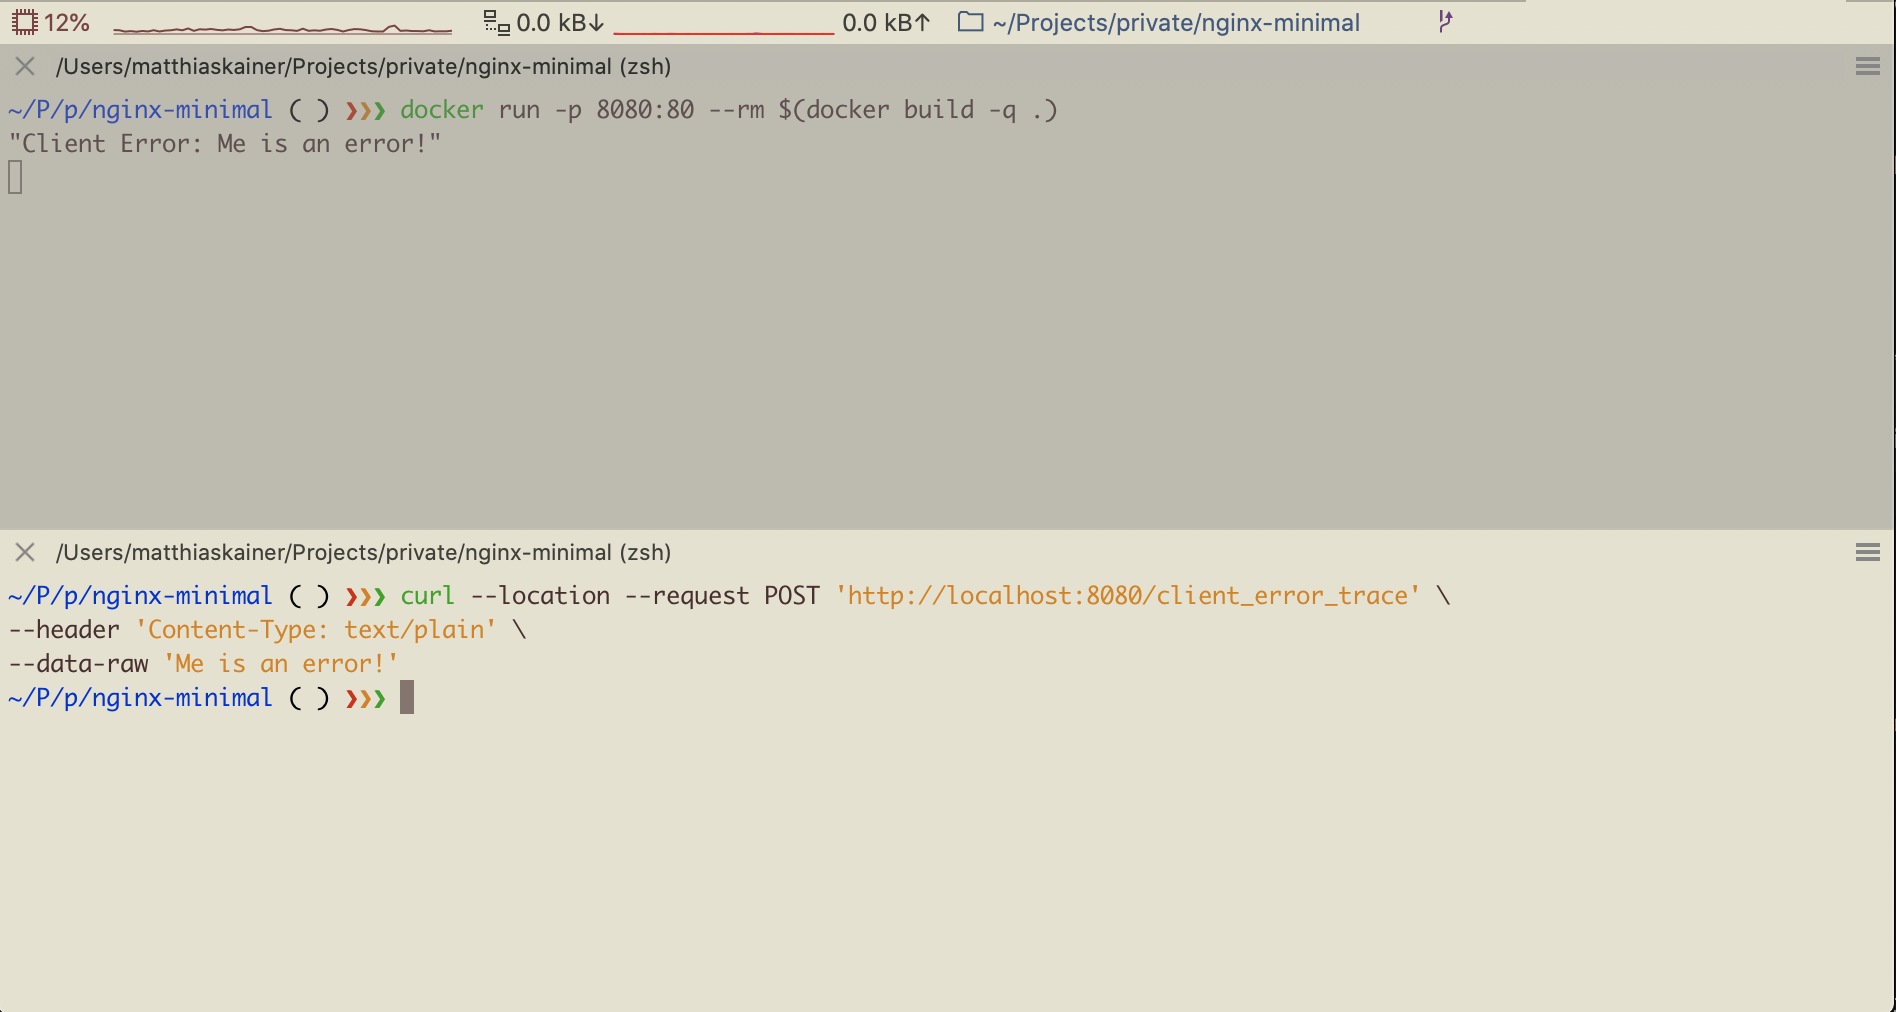
Let’s try it out with the following curl query:
curl --request POST 'http://localhost:8080/client_error_trace' \
    --header 'Content-Type: text/plain' \
    --data-raw 'Me is an error!'
Looking at the nginx logs we can see that indeed the data was logged.

All we have to do now is writing the logs from the browser to this endpoint.
Sending errors from the browser
There are two things we are interested in based on the buttons that we have created - unhandled exceptions, and console.error calls. There might be more things that you are interested in, like failed network calls. Adding them is done accordingly, but for the sake of this blogpost, those two can provide an example.
To be able to do so at all, we need to be able to call the endpoint. For this, we are going to use fetch, and wrap it in a method like so:
const logMessage = body => {
    fetch("/client_error_trace", {
        method: "post",
        headers: {
            Accept: "text/plain, */*",
            "Content-Type": "text/plain"
        },
        body
    });
};
Whenever we want to write a log now, we can call the method by logMessage("our text"), which is what we are doing next on unhandled exceptions. Add the following two lines of code to this snipped:
const logUnhandledError = evt =>
    logMessage(evt.message);

window.addEventListener("error", logUnhandledError, true);
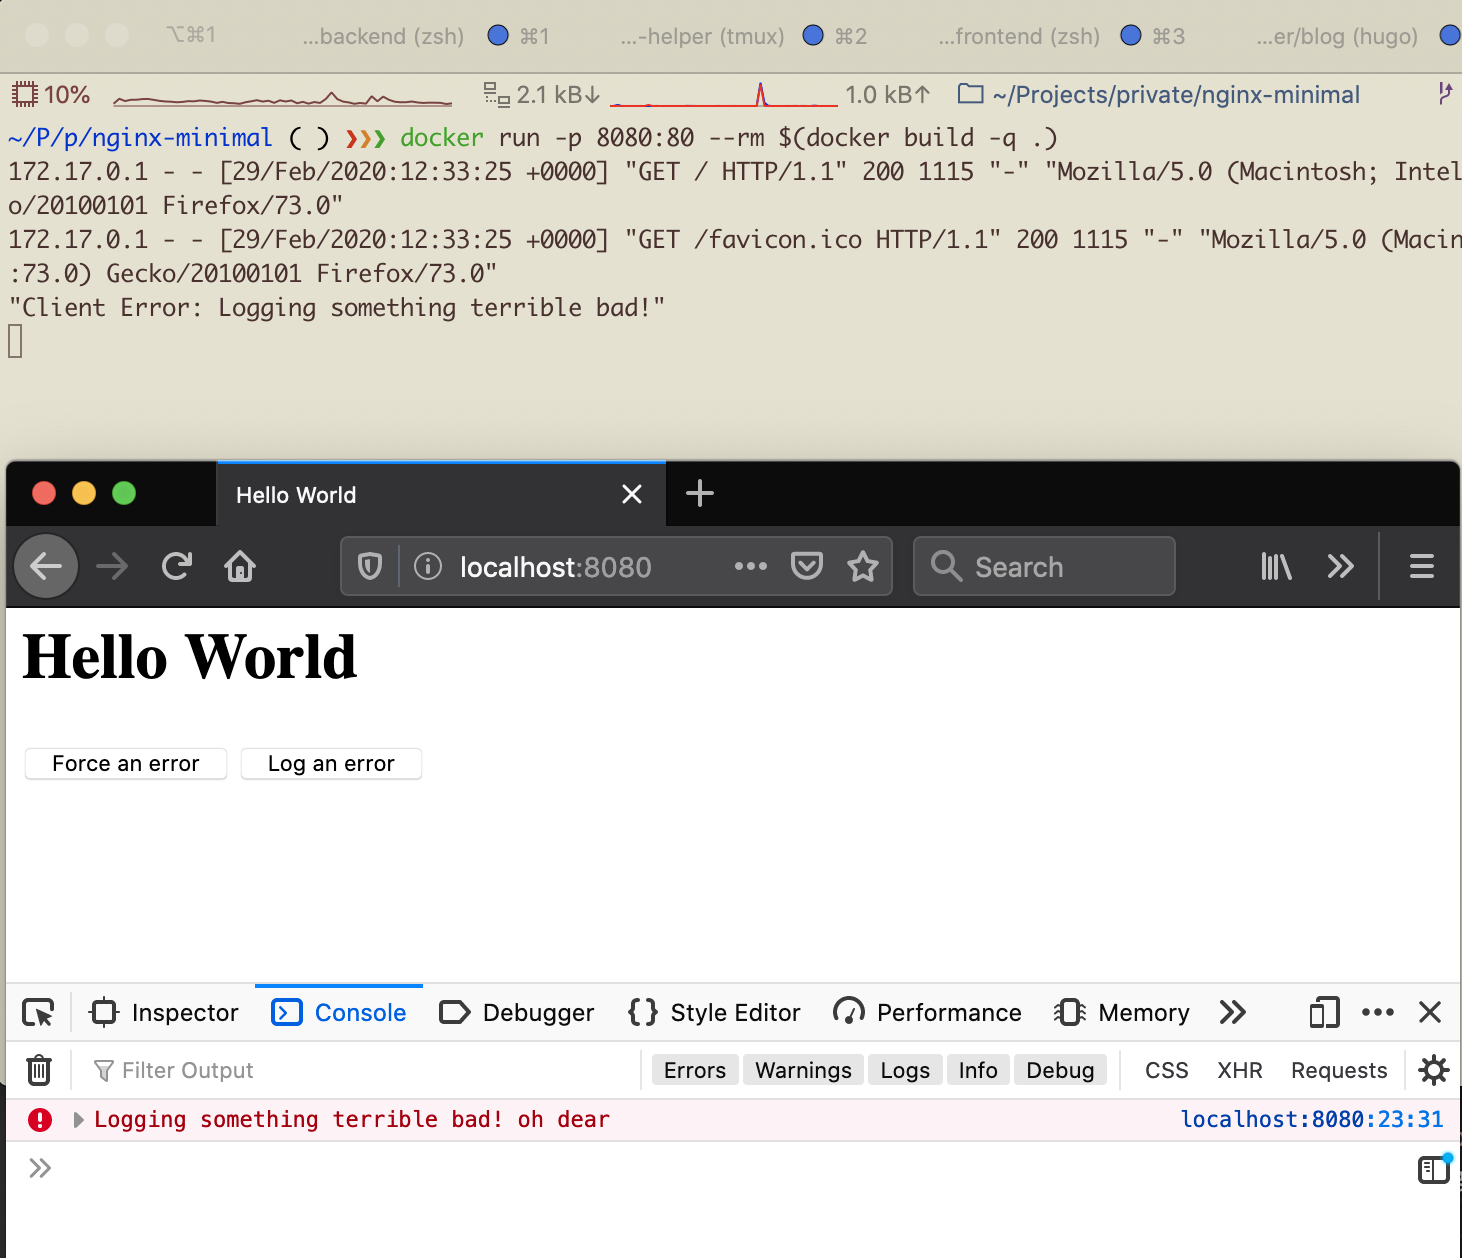
When we reload the docker container now and the page in the browser, and click on the “Force an error” button, we can nicely see the Client Error: Error: Very unhandled exception! entry in the logs of the nginx.

To do the same for console errors, we have to add the following lines:
const consoleError = console.error;
console.error = (message, ...optionalArguments) =>
    logMessage(message) + consoleError(message, ...optionalArguments);
First we remember the old console.error in the variable consoleError (so that we can still show the errors in the browser), and then we overwrite it, calling our own logMessage in combination with the consoleError. The result is logged as `` in the nginx logs.

Example repo
You can find a slightly more sophisticated setup on github in my repo MatthiasKainer/nginx-logging-client-errors. If you struggled following this little guide, clone it and follow the readme to see the result.
In this setup, the log messages are more sophisticated, and log more from nginx to enable you more directly to understand what’s going on. Rather then just a message, you would get more information that looks more like
172.17.0.1 - - 0.000 0.000 [29/Feb/2020:12:39:40 +0000]
    "POST /client_error_trace HTTP/1.1" 200 12
    "Client Error: [Error] Error: Very unhandled exception! at linenumber: 3 of file http://localhost:8080/scriptWithError.js"
    "http://localhost:8080/"
    "Mozilla/5.0 (Macintosh; Intel Mac OS X 10.15; rv:73.0) Gecko/20100101 Firefox/73.0" "-"
giving you not just the error, but even the file and number in the file.